Welcome to Day 6 of our 30DayMapChallenge series! Today’s theme, “Dimension”, moves us beyond flat representations of space and explore how height, density, and volume reveal new truths about our urban environments.
Today’s theme: Dimension
AT A GLANCE:
- Lagos Population Volume: Population volumes of Lagos, Nigeria, built from high-resolution gridded population data.
- 3D Population Extrusion: Extruded 3D population density visualization of Lagos, Nigeria.
- Illuminated Spatial Inequality Map: Illuminated 3D rendering showing spatial inequality and human concentration.
Reading time: 2 minutes | Map Challenge Day: 6 of 30 | Theme: Dimension
Lagos: Where Population Meets Space
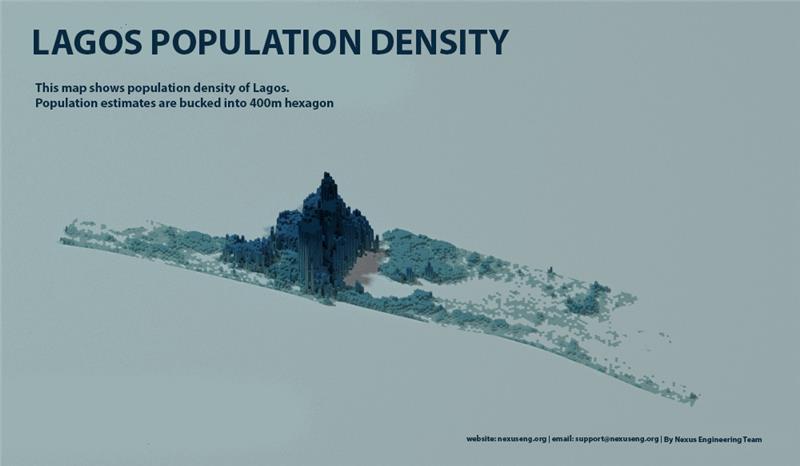
This visualization reimagines Lagos—West Africa’s economic and cultural heartbeat—through the lens of vertical data storytelling.
Using Kontur Population Data 2023, each extrusion represents population density, transforming the map from a flat surface into a dynamic 3D terrain of people.
The city’s core—mainland districts like Mushin, Agege, and Ikeja rises sharply in digital relief, revealing intense human concentration. By contrast, the island zones of Lekki and Victoria Island extend in gentler forms, showcasing recent urban expansion into lower density corridors.
This dimensional perspective allows us to see Lagos not just as a city, but as a living organism—one that breathes, expands, and adapts to economic forces and environmental pressures.
The Technique Behind the Visualization
Data + Dimension = Understanding
| Layer | Description |
|---|---|
| Population Data | Kontur Population Grid (2023), 100m resolution, providing fine-grained population estimates |
| Base Map | Administrative boundaries from GADM and OpenStreetMap |
| Rendering Engine | ”rayshader” in R for 3D extrusion and lighting |
| Workflow | Population grid raster → normalization → extrusion height mapping → terrain illumination |
This pipeline transforms data into a physical metaphor for human presence—where each pixel’s height embodies the density of life within it.
Special thanks to Spencer Schien, whose 3D cartography tutorials are a constant source of inspiration, empowering geospatial storytellers to move beyond the traditional 2D plane.
Data Sources: Kontur Population Grid (2023), 100m resolution, providing fine-grained population estimates
Software: R programming with rayshader, sf, terra, and tidyverse packages
Why Dimension Matters?
Seeing the City Beyond Flat Lines:
In sustainability planning, how people occupy space vertically is as crucial as where they live horizontally. Population density is not merely a number—it’s a measure of infrastructure demand, environmental pressure, and social opportunity.
This 3D rendering highlights:
Vertical population inequality: High density “peaks” often coincide with informal settlements under stress.
Horizontal sprawl: Expanding low density fringes increase carbon footprints and transport inefficiencies.
Sustainable thresholds: Identifying zones where density can support transit, services, and energy efficient development.
By giving dimension to density, we translate abstract statistics into spatial realities that planners, policymakers, and citizens can engage with.
Urban Dimension as a Planning Tool
From Visualization to Civic Insight
At Nexus Engineering & Planning Ltd., our work goes beyond aesthetics.
We use dimensional mapping to help cities visualize challenges and opportunities in spatial equity, housing, and sustainable design.
Through geospatial intelligence, we enable:
- Urban Planners: To identify high density stress zones needing infrastructure upgrades.
- Transport Engineers: To align public transit routes with population “ridges”.
- Environmental Analysts: To assess heat island effects and resource distribution across vertical density gradients.
- Community Designers: To balance vertical living with access to green space and mobility.
Dimension, when mapped correctly, becomes more than visualization—it becomes a decision making framework.
Understanding Lagos Through Dimension
Lagos’s vertical profile tells a story of resilience and inequality.
The peaks mark areas of opportunity—but also strain: overstretched housing, limited green cover, and high exposure to flood risk.
The valleys represent expansion zones—emerging neighborhoods that hold potential for sustainable design if guided by inclusive policy.
As Lagos moves toward becoming a megacity of over 25 million residents, mapping in 3D gives planners the tools to see complexity, design smarter, and build more equitably.
About the #30DayMapChallenge
The #30DayMapChallenge is a daily mapping and cartography challenge throughout November. Created by Topi Tjukanov, it brings together the global geospatial community to explore creative ways of visualizing spatial data.
This is Day 6: Dimension—theme reminds us that cities are not flat—they are three dimensional ecosystems where human, spatial, and environmental systems coexist.
Over the next 25 days, we’ll continue exploring Nigeria’s spatial story through different cartographic lenses.
Tomorrow: Day 7 — Accessibility - Mapping Equality and Inclusion in Lagos
We’ll explore the accessibility of Lagos State’s road network and assess how inclusive it truly is.
📧 Email: support@nexuseng.org 🌐 Website: nexuseng.org
Follow our #30DayMapChallenge series as we explore different aspects of Nigeria and Africa’s spatial story through maps, data, and analysis. Day 6 coming soon!