Welcome to Day 5 of our #30DayMapChallenge series! Today we focus on “Earth”—the tangible and grounded, what lies beneath our feet and what covers the land.
Today’s theme: Earth
AT A GLANCE:
- 3D terrain visualization combining elevation data with forest cover across the Democratic Republic of Congo (2019)
- The physical foundation: Cuvette Centrale depression cradles Africa’s rainforest heart; eastern highlands create distinct ecological zones
- What covers the ground: Forest density reveals where dense canopy protects the earth and where land has been transformed
- The grounded reality: Real terrain, actual soil, physical forests—home to over 100 million people
Reading time: 3 minutes | Map Challenge Day: 5 of 30 | Theme: Earth
The Map: Where Earth Meets Forest
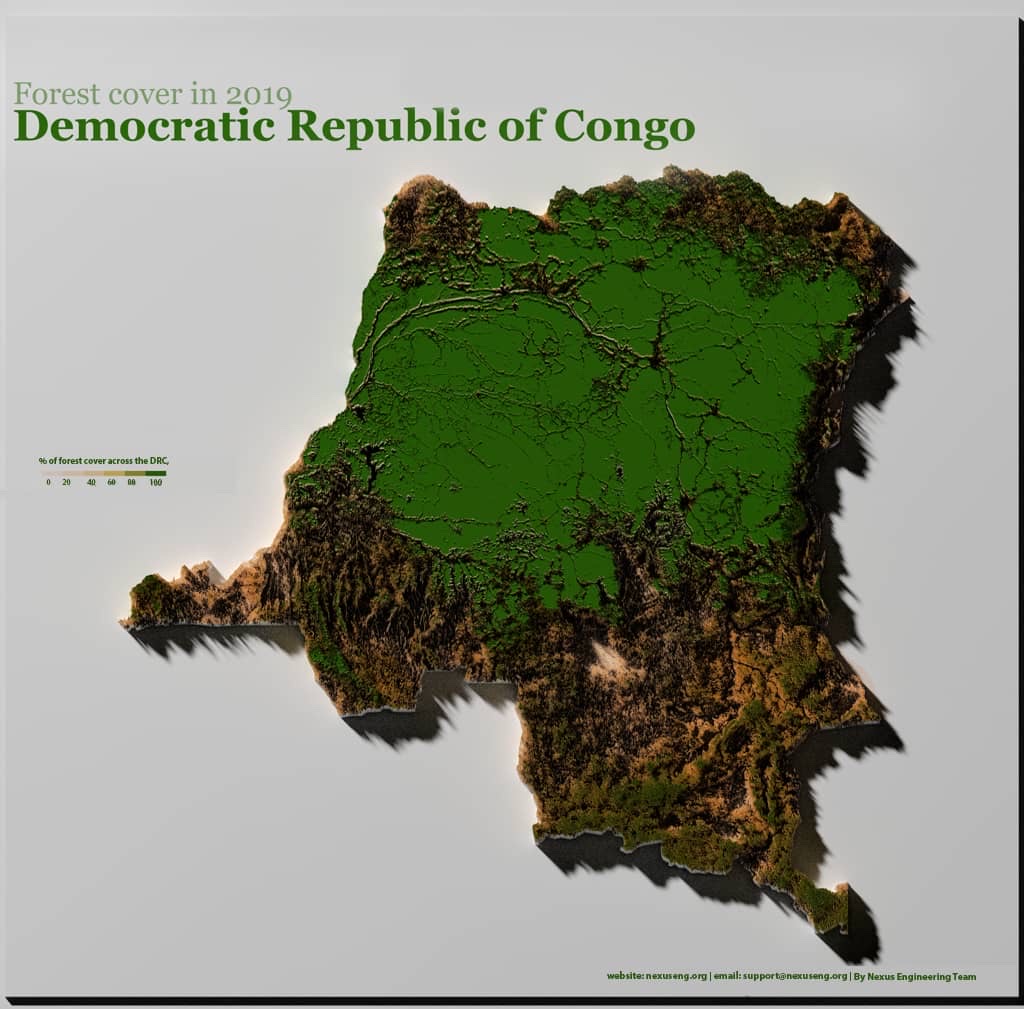
This is Earth—literal ground, physical terrain, actual soil. The visualization layers 2019 forest cover data over Digital Elevation Model (DEM) terrain to reveal the intricate relationship between the land’s physical form and what grows upon it. Every peak, valley, and plateau tells a story of ecology, human activity, and the tangible reality of one of the world’s most critical landscapes.
Elevation Data: NASA SRTM (Shuttle Radar Topography Mission) at 90-meter resolution
Forest Cover: Global Forest Watch 2019 baseline, Landsat satellite imagery
Software: R programming (rayshader, sf, terra, ggplot2 packages)
Technique: 3D terrain rendering with thematic forest cover overlay
Acknowledgment: Visualization inspired by Milos Popovic’s excellent 3D cartography tutorials
Reading the Earth’s Story
The Physical Foundation: Elevation patterns show how the Cuvette Centrale depression cradles the heart of Africa’s rainforest. This vast basin collects water, creates unique soil conditions, and shapes the very ground that supports one of Earth’s critical ecosystems. The eastern highlands rise dramatically, creating distinct ecological zones tied directly to changes in terrain.
What Covers the Ground: Forest cover percentages reveal which portions of the earth remain under dense canopy protection—where soil stays intact, erosion is minimized, and the ground retains moisture and nutrients. The darker green zones represent earth still functioning as nature designed.
Soil and Agriculture: Deforestation patterns in North Kivu, South Kivu, and Maniema mark where the earth has been cleared for cultivation. This isn’t just data—it’s actual soil exposed to erosion, actual ground transformed from forest to farmland, tangible evidence of agricultural expansion reshaping the physical landscape.
The Grounded Reality: This visualization represents real terrain, actual soil, physical forests, and the solid ground that over 100 million people call home. Each pixel corresponds to a physical place where earth, water, vegetation, and human communities intersect.
Reading the Terrain
Understanding the DRC’s physical landscape is essential because terrain fundamentally determines everything—where forests can thrive, how water flows, where settlements establish, and which areas remain isolated or accessible. Our 3D visualization reveals three distinct zones:
The Cuvette Centrale Depression: The northern and central regions occupy a massive geological basin where elevations remain low and soils stay waterlogged year-round. This physical characteristic has preserved forest cover for millennia—where the earth dips lowest, the forest remains densest. Poorly drained, nutrient-limited soils make large-scale agriculture challenging, effectively protecting these forests through the ground’s own characteristics.
Eastern Highlands: The eastern provinces sit along the western edge of the East African Rift System, where tectonic forces have created mountains exceeding 5,000 meters (including Mount Stanley at 5,109m, Africa’s third-highest peak).1 These highlands feature volcanic soils—among the most fertile on earth—which paradoxically makes them prime targets for agricultural conversion. The same geological forces that created spectacular terrain also produced ground that can feed dense human populations.
Southern Transition Zone: Southern DRC represents where the earth changes character—soils shift from tropical forest to savanna conditions. Most significantly, this region contains some of the world’s richest mineral deposits: copper, cobalt, diamonds, and gold. Between 2000 and 2014, the DRC lost approximately 12% of its tree cover2—actual ground transformed from forest to farmland, mining operations, and exposed soil.
What the Map Reveals: Forest and Soil
Forest is not merely vegetation—it represents a complete transformation of the earth’s surface. Forest soils differ fundamentally from agricultural or bare ground in structure, chemistry, and biological activity.
The deep green areas mark where earth remains under continuous canopy. These soils contain centuries of accumulated organic matter, complex fungal networks, and root systems that stabilize ground and regulate water. The Congo Basin’s forests absorb an estimated 1.2 billion tonnes of CO₂ annually3—carbon stored in both biomass and soil.
The lighter patches—particularly visible in North Kivu, South Kivu, and Maniema—show where earth has been exposed. Once forest is removed, tropical soils rapidly degrade: organic matter oxidizes, nutrients leach away, erosion begins. Slash-and-burn agriculture creates a patchwork landscape where earth exists in various stages of recovery or degradation, with soil fertility collapsing after 2-3 years of cultivation.
Why This Matters for Conservation and Development
Understanding terrain provides crucial intelligence for stakeholders: Conservation planners can identify which terrain types naturally support forests versus those facing conversion pressure. Agricultural planners can design systems matching earth’s physical capabilities—volcanic soils in the east can sustain cultivation; sandy central basin soils cannot. Infrastructure developers can route projects to minimize earth-moving and forest clearing. Local communities can learn which soils regenerate after farming and which become degraded wastelands.
The DRC’s terrain will remain—mountains won’t move, and the Cuvette Centrale won’t drain—but what covers that terrain continues to transform. Forest soils hold significantly more organic carbon than agricultural soils (often 3-5 times more).4 Erosion from cleared slopes sends sediment into rivers. Exposed earth reflects more solar radiation, altering local climate. These are tangible changes to the ground beneath over 100 million people’s feet.
How We Use This Data
At Nexus Engineering & Planning Ltd., we apply terrain analysis to real-world projects across Africa. Our capabilities include environmental baseline assessments, erosion control system design, land suitability analysis, and infrastructure routing that works with—rather than against—the earth’s physical characteristics.
This Congo Basin visualization demonstrates how satellite data, elevation models, and spatial analysis can reveal the relationship between terrain and land use. Whether supporting conservation planning, infrastructure development, or sustainable agriculture, understanding the ground itself provides the foundation for evidence-based decision-making.
About the #30DayMapChallenge
The #30DayMapChallenge, created by Topi Tjukanov, is an annual social media event bringing together cartographers, GIS professionals, and mapping enthusiasts worldwide. Throughout November, participants create and share maps based on daily themes, celebrating the art and science of cartography.
Day 5’s “Earth” theme focuses on the tangible and grounded—mapping what’s physically real beneath our feet: terrain, soil, elevation, geology, and the solid ground that shapes everything above it.
Over the next 26 days, we’ll continue exploring Nigeria’s spatial story through different cartographic lenses.
Tomorrow: Day 6 — Dimension - Mapping Lagos Beyond 2D
We’ll explore the 3D representation of Lagos State, Nigeria’s pollulation density.
Need terrain analysis, environmental baselines, or land suitability assessments for your project?
Every successful infrastructure, conservation, or development project starts with understanding the earth itself—the actual terrain, real soil conditions, and physical characteristics of the landscape.
Email: support@nexuseng.org Website: nexuseng.org
Follow our #30DayMapChallenge series as we explore different aspects of Nigeria and Africa’s spatial story through maps, data, and analysis. Day 6 coming soon!
References
Footnotes
-
Rwenzori Mountains/Mount Stanley (Margherita Peak), located on the DRC-Uganda border, reaches 5,109 meters elevation, making it Africa’s third-highest mountain after Kilimanjaro and Mount Kenya. ↩
-
Hansen, M.C., Potapov, P.V., Moore, R., et al. (2013). High-Resolution Global Maps of 21st-Century Forest Cover Change. Science, 342(6160), 850-853. Data accessed via Global Forest Watch (www.globalforestwatch.org). ↩
-
Hubau, W., Lewis, S.L., Phillips, O.L., et al. (2020). Asynchronous carbon sink saturation in African and Amazonian tropical forests. Nature, 579, 80-87. The Congo Basin forests are estimated to absorb approximately 1.2 billion tonnes of CO₂ annually, though recent research suggests this rate may be declining. ↩
-
Powers, J.S., & Schlesinger, W.H. (2002). Relationships among soil carbon distributions and biophysical factors at nested spatial scales in rain forests of northeastern Costa Rica. Geoderma, 109(3-4), 165-190. Tropical forest soils typically contain 3-5 times more organic carbon in the top meter compared to agricultural soils, though the exact ratio varies by soil type, climate, and land use history. ↩